The “Claw of Averages” (COA) is the story of misunderstanding business metrics to create false readings!
Why the Claw of Averages? Averaging claws profits by shredding them, making it difficult to see the nuances, problems or hear warning bells.
Here’s why!
Most businesses make sense of figures by mooching up a wide spread of numbers to create averages or dashboards to run their business.
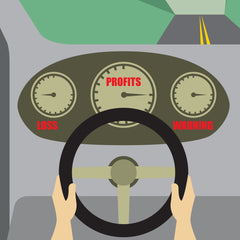
Dashboards position key business indicators into easy view, allowing management to interpret and action if required.
Imagine a picturesque mountain replete with valleys and surrounding crystal clear lake. Each geographic feature has a separate yet unique value, differentiating its individuality from the terrain it surrounds.

Now, as unthinkable as it may be, averaging is the equivalent of pounding the mountain into rubble, dumping tailings into the surrounding valley and clean lake to create a flat road.

Ironically, the purpose of dashboards or metrics is to highlight exception not hide it!
Worldwide, the universally accepted average to monitor the health of a bar business is called Cost of Goods Sold (COGS) - total costs divided by total sale. The figure widely relied on by many bars is 20%. This number (or whichever one is used) provides “visibility” to monitor and measure profits.
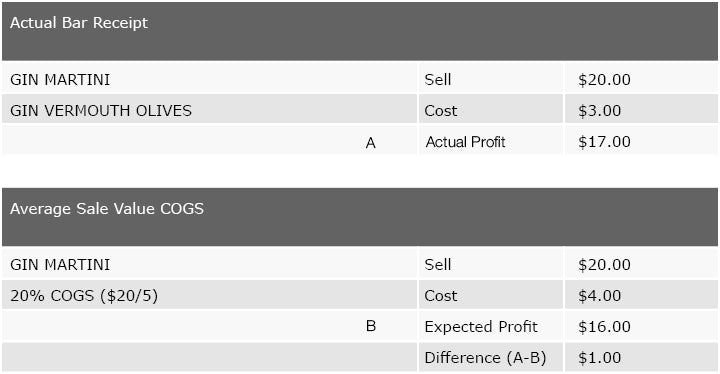
Here’s an example of a 20% COGS in an upmarket bar:
Question:
So where’s the missing $1.00?
Answer:
The $1 exists as either over-poured alcohol or maybe worse!
Businesses doing stock or inventory control may say “hang on, we do inventory control… if we lost a buck, we’d see it (in terms of volume and $) in our metrics”; which may in some instances be true.
To answer this refrain: every Ops person on the planet understands that rarely do depletions (stock on hand less POS sales) ever match. To overcome this headache, its standard practice to allow a “few points variation” on the COGs figure, to explain away or diminish the exception! Remember, averaging or COA, generates small unnoticeable ripples, rather than a huge pot hole; unseen due to (statistical) infill!
Averaging a bar’s costs between the speed rail and the premium priced back bar exacerbates the COA problem. The higher potential wastage/loss at the volume speed rail, the easier it is to hide losses within a mountain of extra-ordinary profits created from higher $ value back bar sales (with the greatest disparity between cost price and sell price).
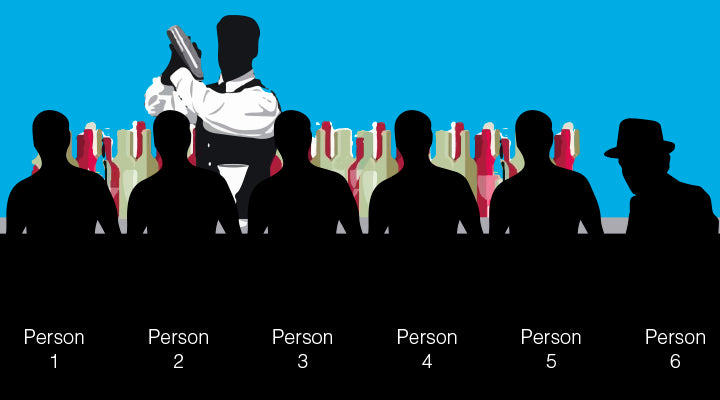
To make the case, imagine a fictitious bar with 6 people in it… here’s the age break down:
|
Person 1 |
10 years old |
| Total Age | 128 years |
| Average Age | 21.33 years old (128/6) |
The average age (COA) is over 21, the legal drinking age in the US! Yet it’s plain to see to anyone sitting in that bar, there’s just one person capable of being legally served, yet, on average, the view removed from that bar indicates an age of over 21, so is everything fine?
The “Claw of Averages” can make and break a business!
Too often beverage managers, directors and operations people make decisions based on averaged numbers, not understanding the consequences of levelling mountains to create indistinguishable flat roads.
Liquor loss, wastage and worse are pot holes, they’re hard to see unless you know where to look.
The COA is out to get you… now, WATCH OUT!